Meta Pixel Saltar al contenido
Basic level

Power BI basic course for companies

A Power BI basic course for teams that report in Excel today and have never opened Power BI Desktop. In 12 hours they connect their own files, clean the data with Power Query, build a simple model that does not break, write their first DAX measures and publish a dashboard that refreshes on its own. No technical prerequisites: using Excel at work is enough.

Power BI basic course

What is the Power BI basic course?

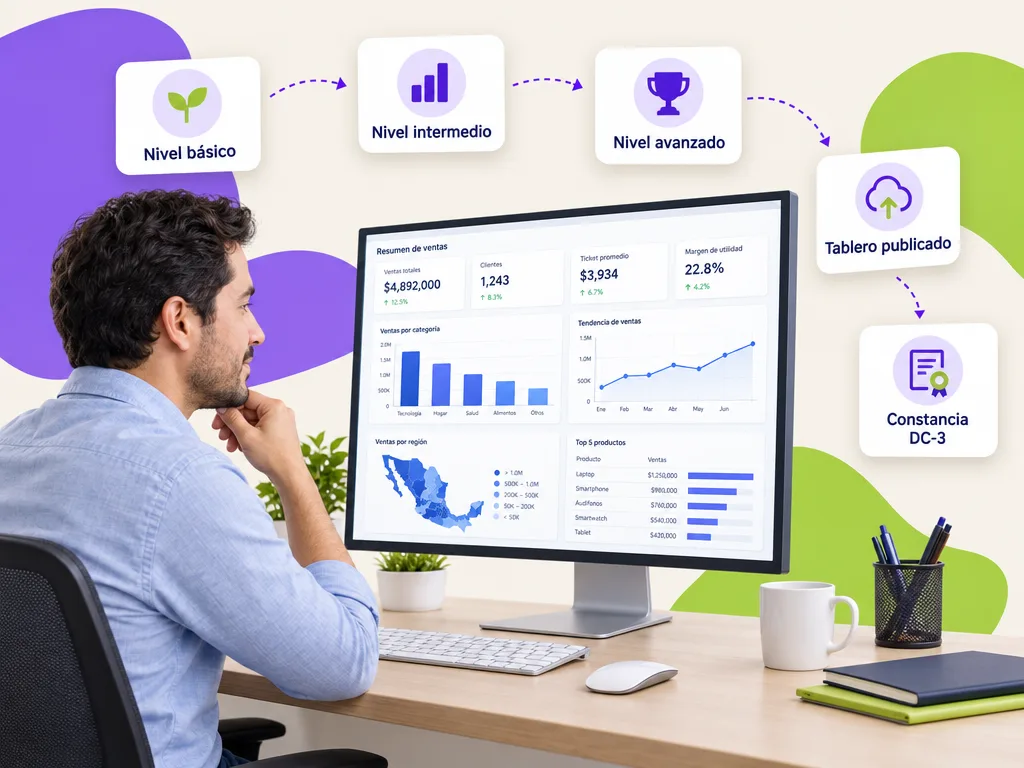
It is the first level of our Power BI path: a 12-hour program that takes a person from zero to their first published dashboard. Participants install Power BI Desktop, connect Excel and CSV files, transform them with Power Query, build a data model with two or three related tables, write sum, count and percentage DAX measures and design clear visuals. At the end, each participant publishes a dashboard to the Power BI service and shares it with their area. If your team already masters this, the Power BI intermediate course starts where this one ends.

How long is the course and how is it delivered?

The exact duration is in the first card. It runs on-site at your company, live virtual for teams in several locations or self-paced on the platform; every participant who meets attendance and assessment receives a DC-3 certificate with the STPS, and Geedle Bot answers questions afterwards with the exact minute of the recording.

Duration

12 hours

Formats

Live virtual · On-site · Self-paced

Certificate

DC-3 · STPS

AI agent

Geedle Bot answers questions 24/7 with the exact minute of the recording

Investment

Proposal with three scope options and a closed price in under 24 business hours

What your team will be able to do

Learning objectives observable on the job.

  • Install and navigate Power BI Desktop

    Know the three views (report, data, model), the fields pane and the workflow of a report.

  • Connect and clean data with Power Query

    Import Excel and CSV, remove empty rows, change data types, split columns and append several sheets into one query.

  • Build a first data model

    Relate a fact table to its lookup tables, understand filter direction and avoid ambiguous relationships.

  • Write starter DAX measures and visualize

    SUM, COUNT, DIVIDE and percentage measures; pick the right visual, use slicers and publish the dashboard to the service.

Syllabus

What does the course syllabus include?

Six modules in order, each with a deliverable you apply in your operation the following week. Exercises use real files and cases from your organization, each module's assessment is recorded on the platform and serves as evidence for the DC-3 certificate.

  1. What Power BI is and how you work in it

    Power BI Desktop, service and mobile app; differences with Excel; the connect-transform-model-visualize-publish flow; review of the files each participant brings.

    Map of the dashboard to build
  2. Connecting to data

    Excel, CSV and folder sources; preview, table navigator and good practices so you never depend on a file on someone's desktop.

    Connected sources
  3. Power Query for cleaning

    Data types, removing duplicates and errors, fill down, split and merge columns, appending sheets and reusable applied steps.

    Clean, documented query
  4. A simple data model

    Fact and lookup tables, one-to-many relationships, calculated column versus measure, a basic calendar table.

    Model with 3 related tables
  5. First DAX measures

    SUM, COUNTROWS, DIVIDE, percent of total, formatted measures and a measures folder; typical mistakes of people coming from Excel.

    Catalog of 8 measures
  6. Visualize and publish

    Cards, bars, lines and tables; slicers, interactions, color theme; publish to the service and share with the area.

    Published, shared dashboard
01

Who is the basic level for?

Junior analysts, administrative staff, coordinators and area managers who receive data in Excel and build reports by hand every week: sales, inventory, payroll, quality, customer service or government indicators. Also for university and public-sector teams that want to move from static tables to interactive dashboards without hiring a specialist. No database or programming knowledge needed; if you use Excel every day, you can take this course.

02

What changes in the company after the basic level?

A published dashboard with real data from your operation that refreshes from the source file, with three to five indicators that are calculated by hand today. The team stops copying and pasting between sheets, shares a single report per area and understands the full Power BI flow: connect, transform, model, visualize and publish. And they know exactly what is left for the intermediate level: DAX with CALCULATE, time intelligence and multi-source models.

Want this course at your company?

Request the proposal for the power bi basic course: three scope options with a closed price in under 24 business hours.

For companies, universities and government

01

For companies

Sales, operations, finance and HR dashboards that refresh on their own and that management opens every Monday without asking for a new Excel. We work with your real data and leave the model documented. See how we apply it in courses for manufacturing and industry.
02

For universities

Institutional indicators (enrollment, dropout, graduation, teacher evaluation) consolidated from the student system and surveys into one model with security by faculty. We chain it with the courses for university administrative staff.

03

For government

Dashboards for program indicators, citizen service and budget execution, with row-level security by agency and training records ready for the comptroller. It is part of the courses for government and the public sector.

Case studies

Projects we have already delivered

Real projects told with facts, not promises.

Corporate university

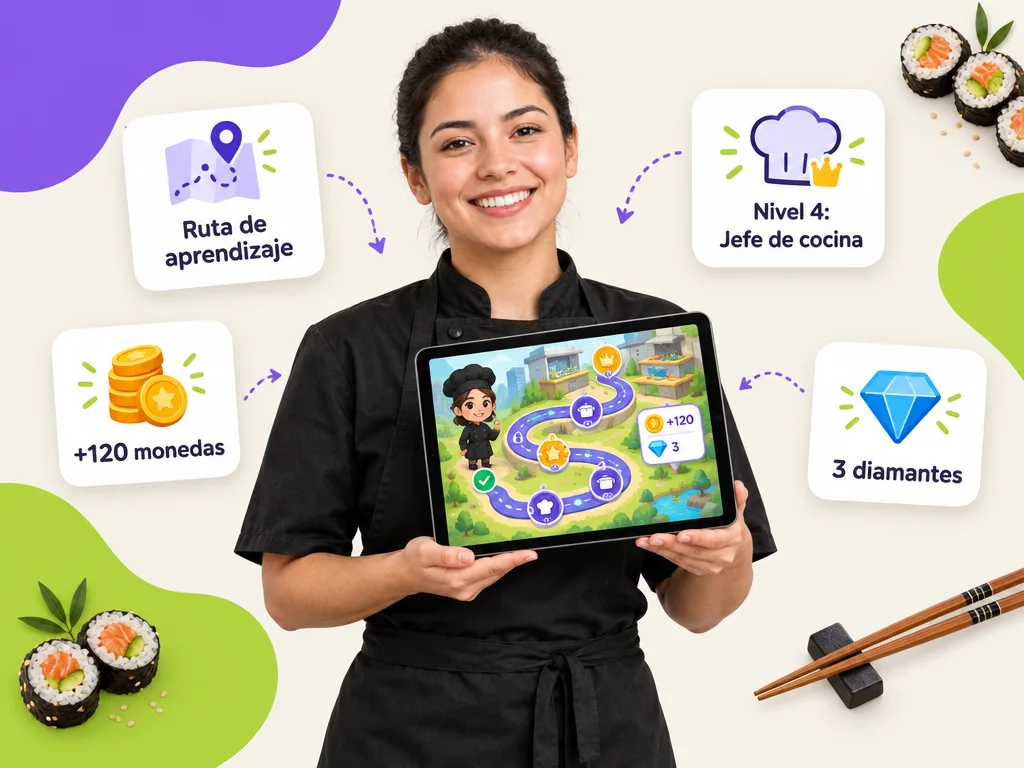
A gamified corporate university for a sushi restaurant chain in Mexico and the US

Train crews spread across restaurants in several Mexican states and the United States with the same standard — and give every employee a clear view of how to grow inside the company.

Read the full case
  • One team from start to finish. Pedagogy, design, development and consulting — nothing critical subcontracted.
  • Fixed price, no surprises. A proposal with three scopes and a closed price for each. You choose the size of the step.
  • We listen before we quote. A free, no-strings assessment: you keep a useful report even if we don’t work together.
Participant asking Geedle Bot on a laptop at night; the agent replies with minute 42:15 of the course recording
Artificial intelligence

An AI agent supports every participant during and after the course

Geedle Bot is trained on the syllabus, materials and recordings of your course. Participants ask in plain language and get an exact answer, not a generic one.

  • Knows every detail of the course: dates, syllabus, deliverables and certificate criteria
  • Solves problems in real time, at any hour, from Moodle, WhatsApp, Teams or Slack
  • Delivers the exact minute and second of the recording where the instructor explained the topic
  • Reinforces what was covered with summaries and review questions, and escalates to the instructor when needed
  • Shows HR which topics raise the most questions so the course can be adjusted

Which format suits each course?

All of them issue a DC-3 certificate and leave records on the platform; what changes is how people practice and how the calendar is organized.

Live virtualOn-site at your companySelf-paced on the platform
Ideal forTeams across several sites or remoteHands-on practice, team dynamics and brigadesRotating shifts and large workforces
InteractionLive instructor, breakout rooms and real casesInstructor in the room, role-plays and practice with equipmentMicrolessons, challenges and automatic assessments
Typical duration2-to-4-hour sessions on different days4-to-8-hour days2 to 4 weeks at your own pace
RecordsAttendance, participation and assessment on the platformRoster, assessment and photo evidenceProgress, grades and time on the platform
Questions between sessionsGeedle Bot 24/7Geedle Bot 24/7Geedle Bot 24/7
CertificateDC-3 with the STPSDC-3 with the STPSDC-3 with the STPS
FAQ

Frequently asked questions about the power bi basic course

Get a quote for this course for your team

Tell us how many people, in which city and in which format. We reply the same day, free and with no commitment.

★

Enter the VIP Zone

Geedle clients only. No passwords: we send a code to your email.

or

Not a client yet? Request your free diagnosis · Privacy notice