Excel or Power BI: which to learn first (and when you need both)
The question almost always arrives the same way: "do I train my team in Excel or move them to Power BI already?". The short answer is that they are not alternatives but stages, and skipping one is expensive. This guide explains what each tool solves, the six signs that your report already needs Power BI and the learning order that wastes the least time.
In this article
What Excel does and what Power BI does
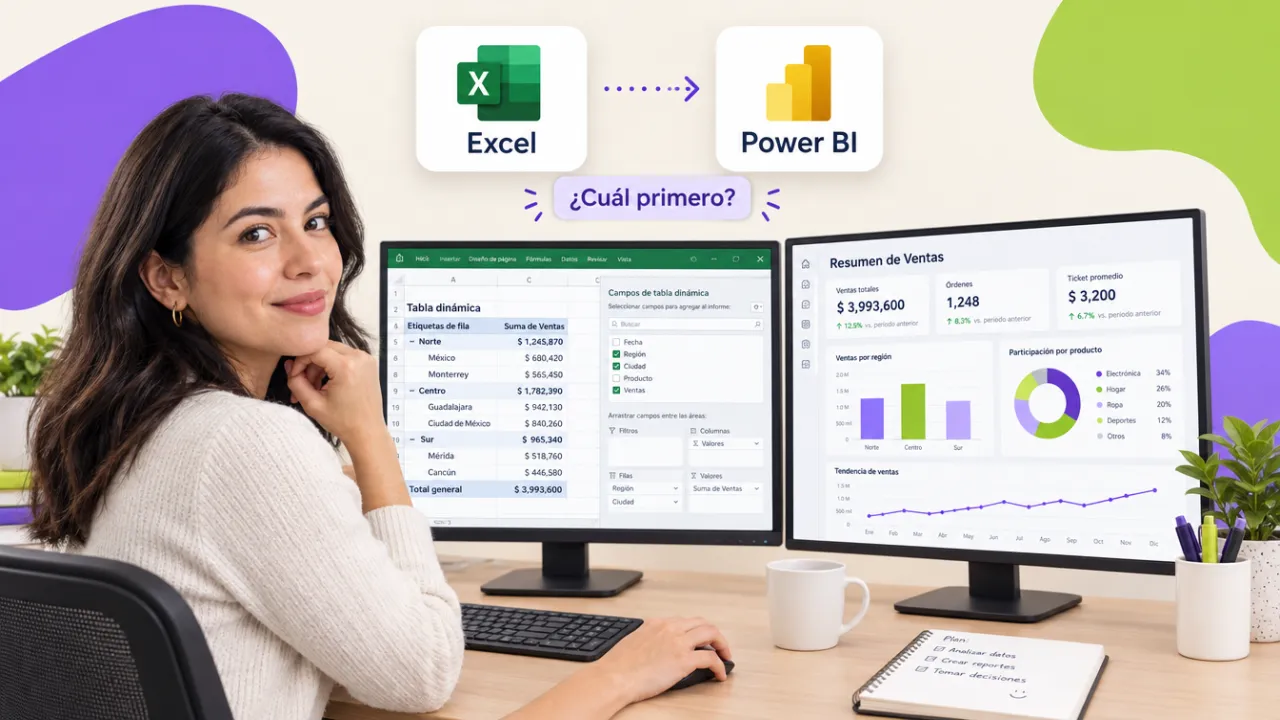
Excel is a spreadsheet: it captures, calculates, summarizes and presents data from one or a few sources. With pivot tables, lookup functions and Power Query it solves most of the administrative work of a Mexican company: payroll, inventory, quotes, reconciliations and weekly reports.
Power BI is a business-intelligence tool: it connects several sources, relates them in a data model, computes measures with DAX and publishes interactive dashboards that refresh on their own and that many people consult with different permissions. It does not replace Excel for data entry or one-off calculations; it replaces it for consolidating and publishing.
The confusion comes from the fact that the two share parts: Power Query and the data model (Power Pivot) exist inside Excel and are the same ones Power BI uses. That is why order matters: whoever masters Power Query and pivot tables in Excel enters Power BI halfway there.
Six signs your report already needs Power BI
- You consolidate by hand every month. If the close consists of copying sheets from several branches or areas into one workbook, the problem is consolidation and Power BI (or Power Query in advanced Excel) solves it at the root.
- Numbers change depending on who builds the report. When each person computes "sales of the month" with a different formula, you need measures defined once. That is DAX.
- You compare periods with fragile formulas. Year-to-date, year over year and moving averages in Excel need helper columns that break when a month is added. In Power BI they are reusable time-intelligence measures.
- Each manager must see only their region. If today you send different copies of the file to each person, you need row-level security.
- Management wants to open it on the phone. An attachment is not a dashboard. Power BI publishes to the service and the mobile app.
- More than a million rows. Excel has a row limit per sheet and gets slow long before; Power BI is designed for that volume.
If you recognize two or more signs, your team already needs Power BI. If you recognize none, well-used Excel is enough for now and it pays to invest there first.
Quick comparison
| Need | Excel | Power BI |
|---|---|---|
| Capture and calculate | Its natural ground | Not for data entry |
| Summarize a dataset with pivot tables | Intermediate level | Equivalent with a model |
| Consolidate several sources | Power Query (advanced level) | Data model that refreshes on its own |
| Compare periods | Formulas per sheet | Reusable DAX measures |
| Several readers with permissions | Protected copies | Row-level security |
| Millions of rows | Sheet limit | Built for that volume |
The learning order that wastes the least time
For a typical administrative team (finance, sales, operations, HR, registrar) the path that works is:
- Excel intermediate: lookup functions, data validation and pivot tables. Without this, Power BI frustrates because nobody understands what a fact table is or why a relationship fails.
- Excel advanced or data analysis with Excel: Power Query and Power Pivot. Here the team learns to consolidate and relate tables inside Excel, which is exactly the model that later lives in Power BI.
- Power BI basic: the same model, now published as a dashboard. The jump is small because Power Query and the model are already familiar.
- Power BI intermediate and advanced only for those who maintain the organization-wide dashboards: DAX with CALCULATE, time intelligence, performance and security.
What does not work is sending the whole team straight to Power BI "because it is modern": half of them do not need to publish dashboards and the other half gets stuck at the data model for not mastering Excel. At Geedle we solve it with a level diagnostic before quoting and with the data analysis learning path from Excel to Power BI, which chains the seven courses in that order.
When it does make sense to start directly in Power BI
There are two exceptions. First: analysts who already master pivot tables and Power Query and whose only problem is publishing and sharing; for them the Power BI basic course is the right entry. Second: IT or data teams coming from databases and SQL; Excel gets in their way and they go straight to the intermediate level.
For everyone else, Excel first. And if you do not know what level your team is at, the Excel course and the Power BI course have an eight-question level test that settles it in two minutes.
Want to bring this to your team?
We run a level diagnostic per person before quoting, so nobody pays for a level too high or too low. Message us on WhatsApp, fill out the contact form or open this site's live chat: we send a proposal with three scope options and a closed price in under 24 business hours, with the DC-3 certificate and Geedle Bot included. The full program is at the data analysis learning path from Excel to Power BI and the catalog at training courses for companies.