For companies
Sales, finance, operations and quality answer concrete questions (margin, compliance, turnover) with their own data and deliver dashboards and reports management uses. We apply it in the courses for manufacturing and industry.
A data analysis with Excel course for staff who already master the tool and still do not know what to do with the data: what to clean, which question to answer, which indicator to compute and how to tell it. In 16 hours your team learns the full method —ask, clean, explore, compute, communicate— with Power Query, pivot tables, Power Pivot and dashboards, on a real dataset from your operation.
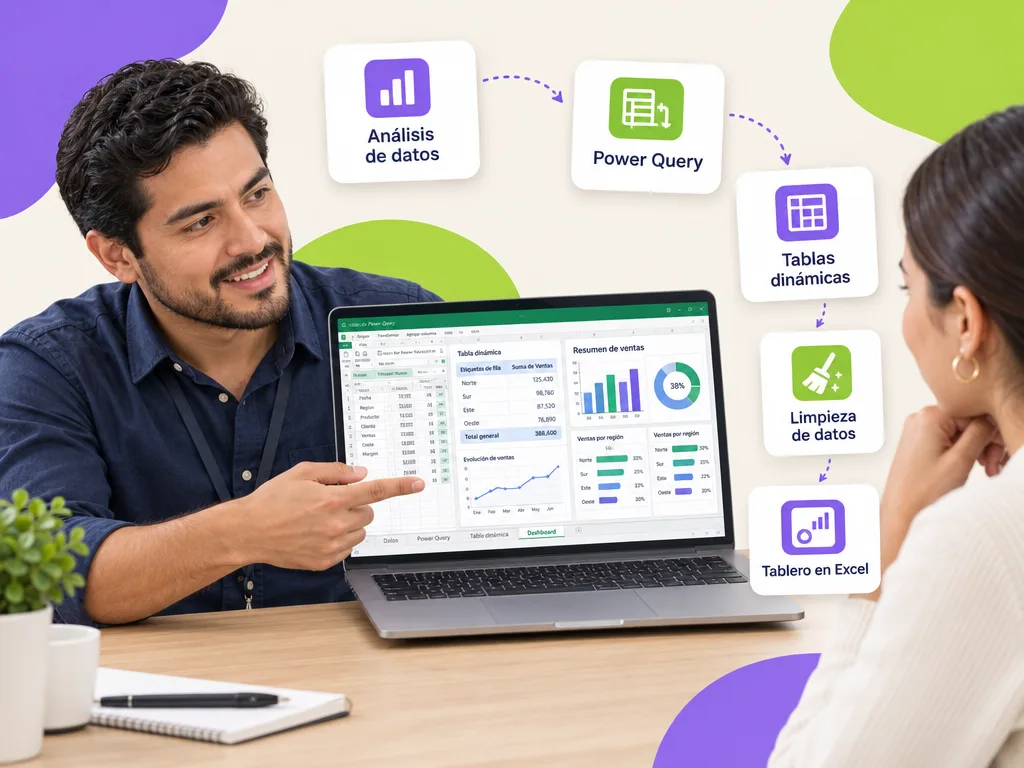
It is a 16-hour program that teaches how to analyze data, not just how to use Excel. It starts with the business question (why is margin falling?, which branch underperforms?, which students drop out?), continues with cleaning in Power Query, exploration with pivot tables and charts, indicator calculation with Power Pivot and simple measures, trend and outlier detection, and closes with a dashboard and a findings report management understands. It is the central stretch of the data analysis learning path from Excel to Power BI and the natural step before the Power BI course.
The exact duration is in the first card. It runs on-site at your company, live virtual for teams in several locations or self-paced on the platform; every participant who meets attendance and assessment receives a DC-3 certificate with the STPS, and Geedle Bot answers questions afterwards with the exact minute of the recording.
16 hours
Live virtual · On-site · Self-paced
DC-3 · STPS
Geedle Bot answers questions 24/7 with the exact minute of the recording
Proposal with three scope options and a closed price in under 24 business hours
Learning objectives observable on the job.
Move from "I want a report" to a concrete question, pick the indicator that answers it and document its definition and source.
Import from several sources, standardize text and dates, remove duplicates and errors, unpivot and leave the process reproducible.
Segment, group, compare periods, compute share and variation, detect outliers and relate tables with Power Pivot.
Choose the right chart, design a one-page dashboard and write a findings report with actionable recommendations.
Six modules in order, each with a deliverable you apply in your operation the following week. Exercises use real files and cases from your organization, each module's assessment is recorded on the platform and serves as evidence for the DC-3 certificate.
Question, hypothesis, data needed, indicator and decision; data types; mistakes that ruin an analysis (samples, misleading averages, correlation and cause).
Analysis brief with question and indicatorsConnecting to files and folders, cleaning text and dates, conditional columns, unpivot, merging sources and one-click refresh.
Clean, reproducible datasetGrouping and segmenting, calculated fields, percent of total and of row, period comparison, distribution and frequencies.
Documented explorationData model, relationships, calendar table, sum, count, average, share and variation measures, and their written definition.
Indicator catalogMoving average, trend line, monthly seasonality, identifying outliers and what to do with them.
Trend analysis of one indicatorChart choice, one-page dashboard with slicers, findings report with recommendations and a plan to move to Power BI.
Dashboard + report presented to managementAnalysts, coordinators and leads in finance, sales, operations, quality, HR, planning and registrar who receive data and must turn it into decisions; evaluation liaisons in government; and anyone who wants to grow into an analyst from their current role. Requires the Excel intermediate level (pivot tables and lookup functions) or equivalent experience.
A real, finished analysis: a clean, reproducible dataset with Power Query, a set of defined and documented indicators (how they are computed, with which data and how often), an Excel dashboard that refreshes with one click and a one-page findings report with recommendations. The team stops delivering tables and starts delivering answers, and is ready to take the same model to Power BI.
Request the proposal for the data analysis with excel course: three scope options with a closed price in under 24 business hours.
Sales, finance, operations and quality answer concrete questions (margin, compliance, turnover) with their own data and deliver dashboards and reports management uses. We apply it in the courses for manufacturing and industry.
Planning, registrar and finance analyze enrollment, dropout, graduation and budget with a reproducible method and a dashboard per faculty. It is part of the courses for university administrative staff.
Evaluation and planning liaisons turn registries and program reports into documented indicators and dashboards for the comptroller, with a DC-3 certificate. It is within the courses for government and the public sector.
Real projects told with facts, not promises.
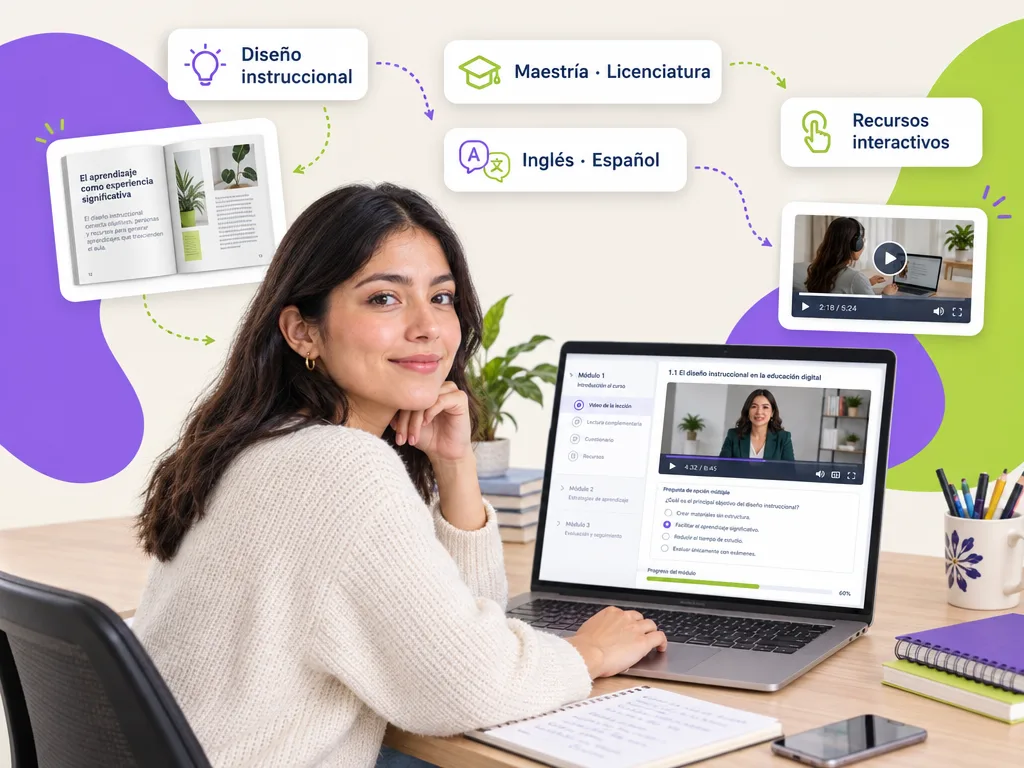
Move graduate and undergraduate subjects, plus English and Spanish language courses, to a virtual format with academic quality and a consistent look.
Read the full case
Geedle Bot is trained on the syllabus, materials and recordings of your course. Participants ask in plain language and get an exact answer, not a generic one.
All of them issue a DC-3 certificate and leave records on the platform; what changes is how people practice and how the calendar is organized.
| Live virtual | On-site at your company | Self-paced on the platform | |
|---|---|---|---|
| Ideal for | Teams across several sites or remote | Hands-on practice, team dynamics and brigades | Rotating shifts and large workforces |
| Interaction | Live instructor, breakout rooms and real cases | Instructor in the room, role-plays and practice with equipment | Microlessons, challenges and automatic assessments |
| Typical duration | 2-to-4-hour sessions on different days | 4-to-8-hour days | 2 to 4 weeks at your own pace |
| Records | Attendance, participation and assessment on the platform | Roster, assessment and photo evidence | Progress, grades and time on the platform |
| Questions between sessions | Geedle Bot 24/7 | Geedle Bot 24/7 | Geedle Bot 24/7 |
| Certificate | DC-3 with the STPS | DC-3 with the STPS | DC-3 with the STPS |
Short reads to decide better before you hire.
Other data, office tools and digital security courses and the full category.
Tell us how many people, in which city and in which format. We reply the same day, free and with no commitment.