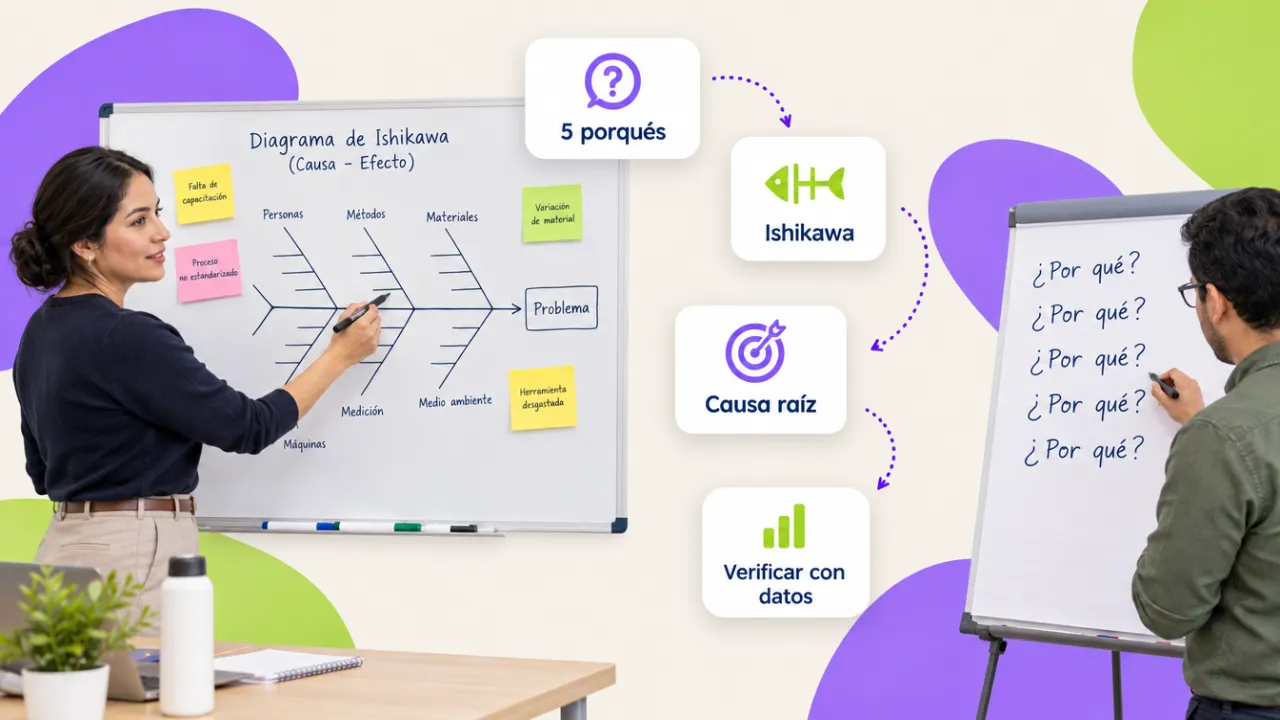
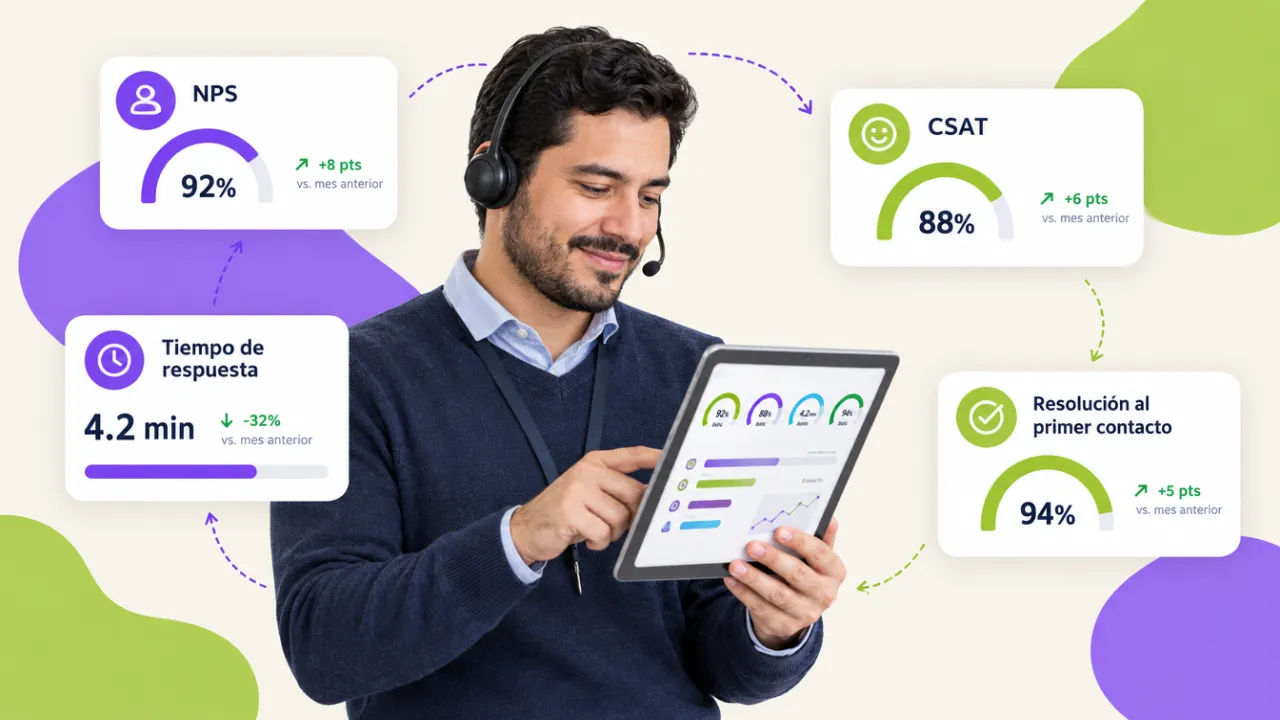
Customer service KPIs you should track: NPS, CSAT, response time and first-contact resolution
"Our service is good" is not a KPI. To improve customer service you need to measure five concrete things, review them every week and connect them to the team's training. This guide explains what each indicator measures, how to compute it with an Excel sheet and what value is reasonable for a service team in Mexico.
In this article
1. NPS: would they recommend us?
The Net Promoter Score asks a single question: "How likely are you to recommend us, from 0 to 10?". Those who answer 9 or 10 are promoters; 7 and 8, passives; 0 to 6, detractors. NPS = % promoters − % detractors, ranging from −100 to 100. It measures loyalty, not a single interaction; it is asked after a full cycle (purchase, delivery, use) and compared against your own history, not against other industries' figures.
2. CSAT: how was this interaction?
Customer satisfaction is asked immediately after an interaction: "How would you rate the service you received today?", from 1 to 5. CSAT = % of 4 and 5 answers. Unlike NPS, it works to evaluate a channel, a shift or a person, which is why it is the indicator most connected to training: if chat CSAT is ten points below the counter, you already know whom to train and in what.
3. First response time
How long the customer waits for the first human reply, per channel. It is not resolution time: it is the time until someone says "I am looking into it". It is the indicator that most influences perceived service and the cheapest to improve: an acknowledgment template on WhatsApp brings it from hours to minutes.
4. First-contact resolution
Percentage of cases solved in the first interaction, with no transfers or "we will call you back". FCR = cases solved at first contact ÷ total cases. A low FCR almost always reveals a lack of authority or information in front-line staff, not a lack of kindness; it is fixed with protocols and permission to solve, which is what the complaint-handling protocol works on.
5. Complaint rate and its causes
Complaints per 100 interactions (or orders), categorized by cause. The number matters less than the list: the three most repeated causes of the month are the improvement plan. If the cause is "late delivery", it is not a service problem but a logistics one, and measuring it avoids training the wrong team.
How to compute them with an Excel sheet
| KPI | Formula | Source | Frequency |
|---|---|---|---|
| NPS | % promoters − % detractors | Survey after a full cycle | Monthly |
| CSAT | % of 4 and 5 answers | Survey after each interaction | Weekly, per channel |
| First response | Median time to first reply | Channel log (chat, email, CRM) | Weekly |
| First-contact resolution | Solved at first contact ÷ total | Case categorization | Weekly |
| Complaint rate | Complaints ÷ interactions × 100, by cause | Complaint log | Monthly |
One table per channel, one column per KPI and a pivot table per week are enough; if the team does not master pivot tables, the Excel course for companies covers it at the intermediate level.
What values are reasonable
It depends on the channel and the industry, but as a starting reference: CSAT above 80%, first-contact resolution above 70%, first response in chat and WhatsApp under 5 minutes and in email under one business day. More useful than the absolute value is the trend: a CSAT that rises five points after a course says more than any industry average.
Connecting KPIs to training
Measure before the course, train with the team's real cases and measure eight weeks later. It is how you know whether the customer service course moved the indicator that mattered, and the evidence management needs to keep investing in the front-line team.
Want to bring this to your team?
We design the course from your current KPIs and measure CSAT and first-contact resolution before and after. Message us on WhatsApp, fill out the contact form or open this site's live chat: we send a proposal with three scope options and a closed price in under 24 business hours, with the DC-3 certificate and Geedle Bot included. The full program is at the customer service course and the catalog at training courses for companies.